
For much of modern economic history, the value of many currencies, including the U.S. dollar, was directly tied to a specific amount of gold. This system is known as the gold standard. Under this system, countries held vast reserves of gold to back their currencies and international trade imbalances were settled using gold. This provided a measure of confidence in the stability of those currencies and the global financial system.
After World War II, the Bretton Woods system established the U.S. dollar as the world's primary reserve currency, linked to gold at $35 per ounce. Other major currencies had fixed exchange rates with the U.S. dollar but were not directly convertible to gold. This effectively placed them on a gold standard through the U.S. dollar.
By the 1960s, the U.S. faced economic pressures at home, including rising inflation and public spending due to the Vietnam War and other factors. At the same time, European and Japanese economies were recovering and growing rapidly, leading to trade imbalances. As a result, there was increasing doubt about the U.S.'s ability to maintain the $35/ounce conversion rate of the dollar to gold.
This doubt led to an increase in gold outflows from the U.S. as foreign governments and institutions, worried about the U.S.'s ability to maintain the dollar's value, began converting their dollar holdings into gold.
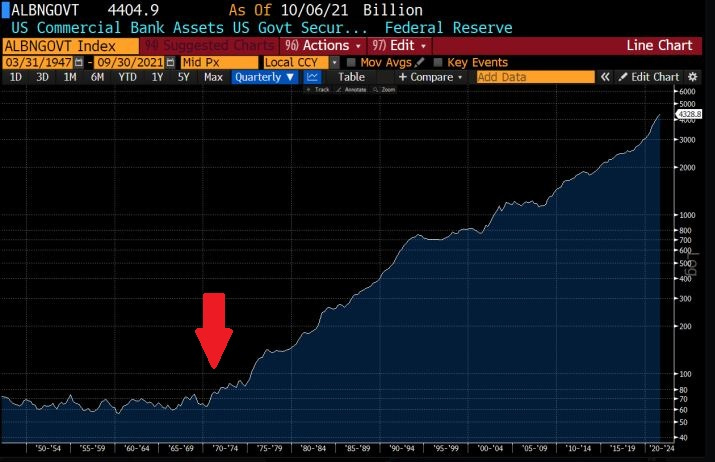
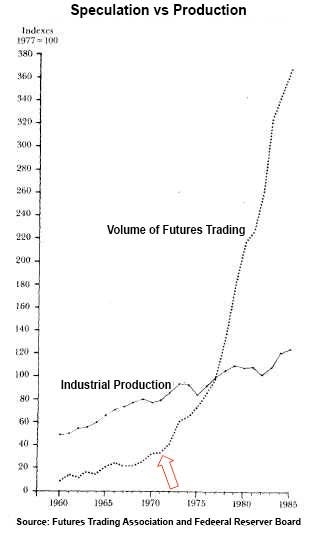
On August 15, 1971, in response to these challenges and to stave off a run on U.S. gold reserves, President Richard Nixon announced a series of economic measures, known as “The Nixon Shock”. The most significant of these was the suspension of the U.S. dollar's convertibility into gold. This move effectively ended the Bretton Woods system and transitioned the world into a fiat currency system, where money isn't based on physical commodities but rather the trust and confidence of the people who use it.
The aftermath of that shock can be seen in a great website called WTF Happened in 1971. The graphs below are from the website but go to the website yourselves to see all the data provided.


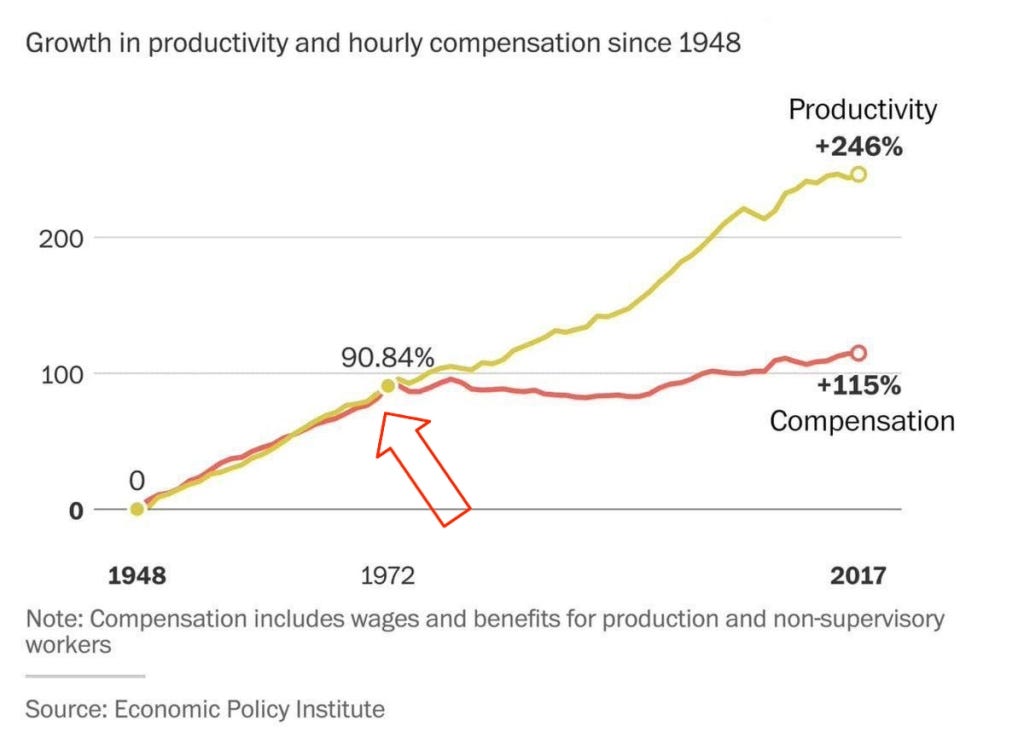
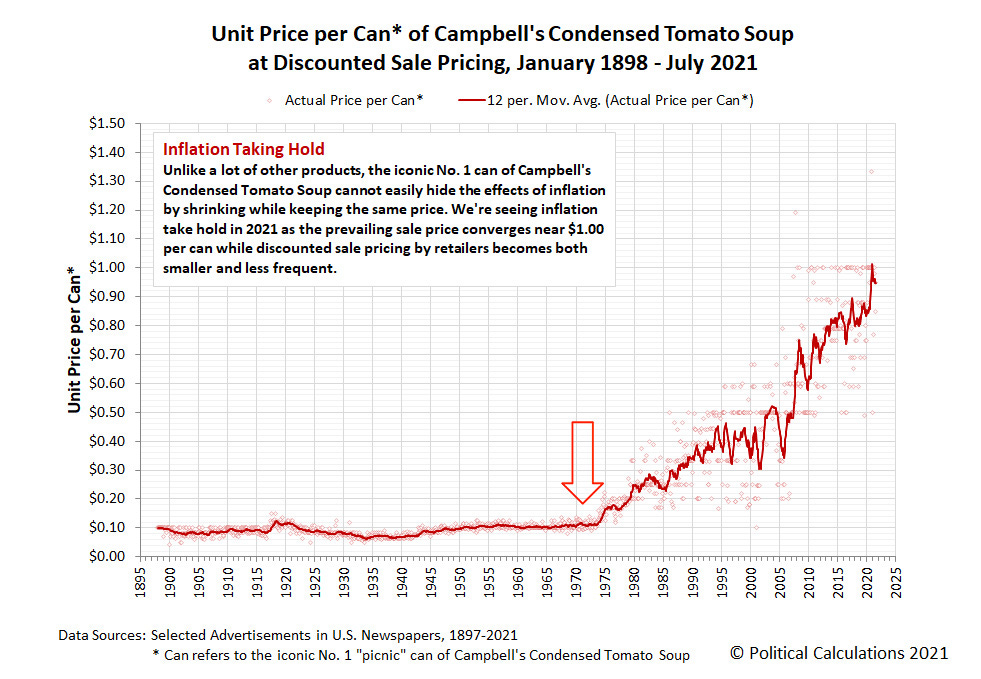
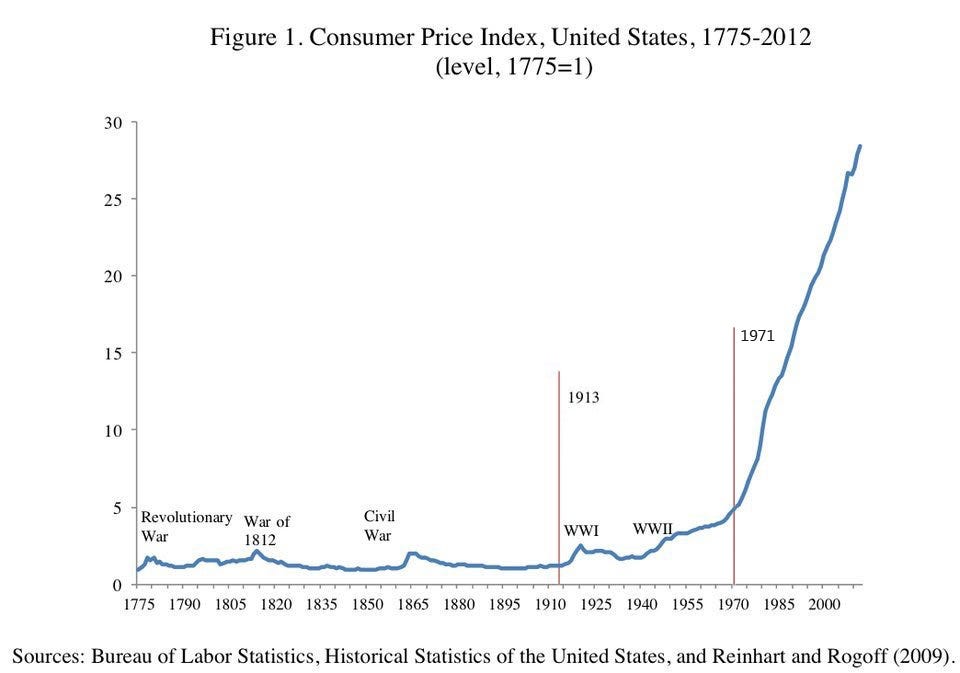
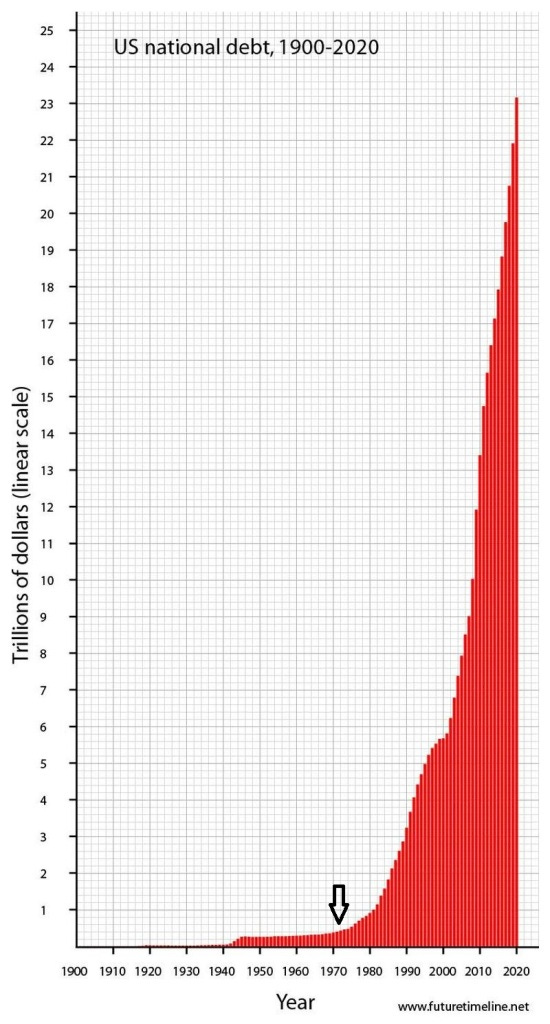


My head has fallen off from all the vigorous nodding. Please help.
Just a terrific, succinct essay on what happened in ‘71. And if a picture’s worth a thousand words, your graphs are worth one hundred thousand. The trend lines are like rockets after ‘71. The gap between productivity and compensation would dilate the eyes of Thomas Piketty.
Fantastic job...thank you.