Following on from my article “The Everything Bubble, The End Of Growth & Managing Expectations - A theory to explain everything”, I thought I would post an example of the decline in western prosperity, in reality.
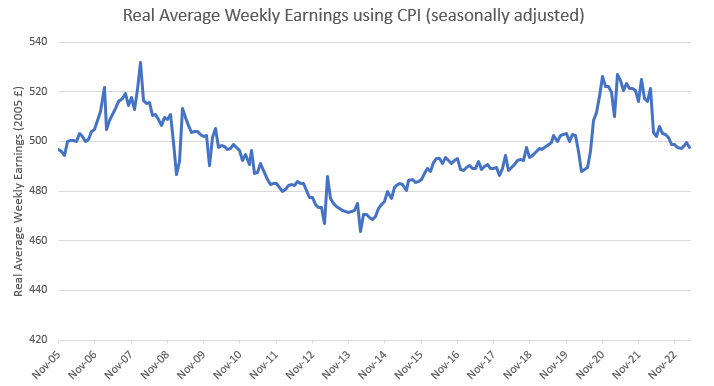
The Office for National Statistics (ONS) (in the UK) publish seasonally adjusted real average weekly earnings using consumer price inflation (CPI).
This week, average weekly earnings went back down to £497 ($637). This is the same figure as it was in 2005. Almost 20 years of stagnant wage growth. This is the longest period of wage stagnation since the Napoleonic wars (between 1803 and 1815).
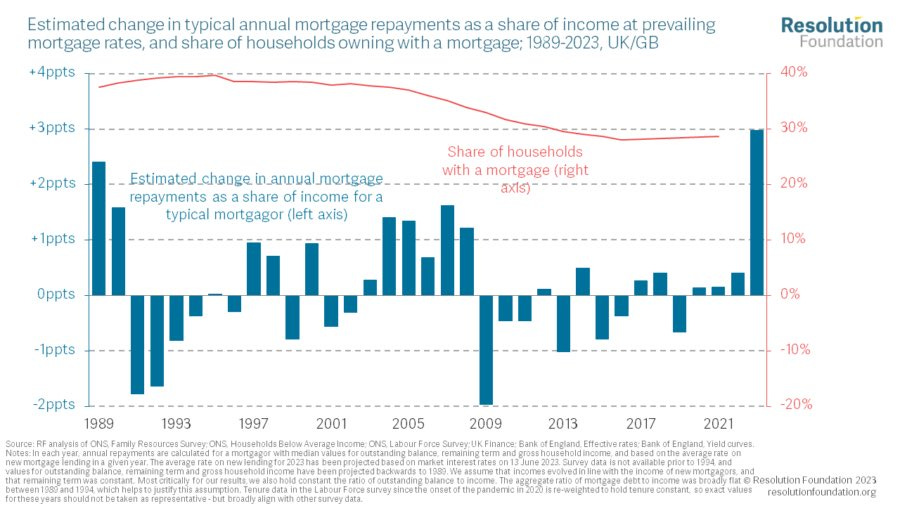
With an impending mortgage crisis on the way, this decline in prosperity will hit families more than other demographics. This is because many older people will own their properties outright and younger people just can’t afford to buy.
As Economics Editor of Sky News, Ed Conway, says “Rising Interest Rates Are A Bigger Deal Than You Might Think - I’m a bit worried people are being WAY too complacent about rising interest rates.”
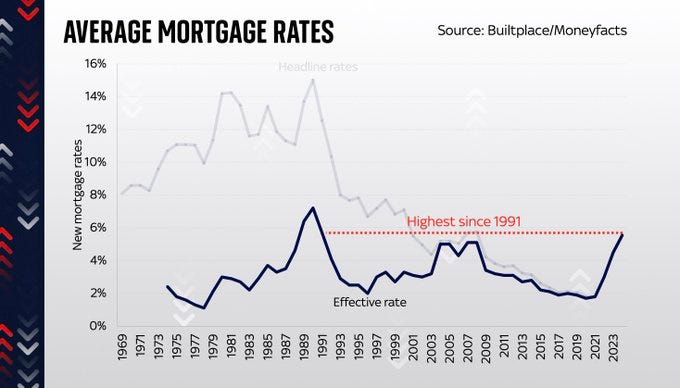
When he wrote his thread in 2022, the Bank of England’s comically terrible expectations were for interest rates to peak at 4.75% this year. They are already forecast to go to 5.75% and most likely higher.
Ed correctly points out that older generations claim that everything will be fine as they experienced much higher interest rates. I’m sure that if you have ever chatted to someone who had a mortgage in the ‘70s, they will tell you how their interest rates were 14% or higher.
But it doesn’t matter what the interest rate is, it matters how affordable the mortgage is.
In 2005, the average house price was roughly half what it is now. So with average wages the same as they were in 2005 but with mortgages on much more expensive properties, things are going to get very difficult for families. A much higher proportion of their salaries will have to be spent on mortgage payments, rather than as disposable income on discretionary items.
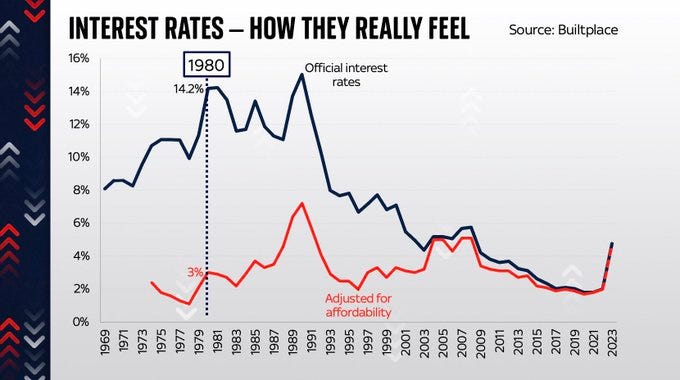
Ed produced a graph which shows official interest rates adjusted for affordability. So in the graph below an interest rate of 14.2% in 1980 is equivalent to interest rates of 3% today.
Interest rates in 2023 have already reached adjusted interest rates for 2007, just before the financial crisis (4.75%). As I said, they are predicted to go to 5.75% but if they reach 6% the “mortgage burden would be very similar to the early 1990s - which precipitated the worst housing crash in modern history”.
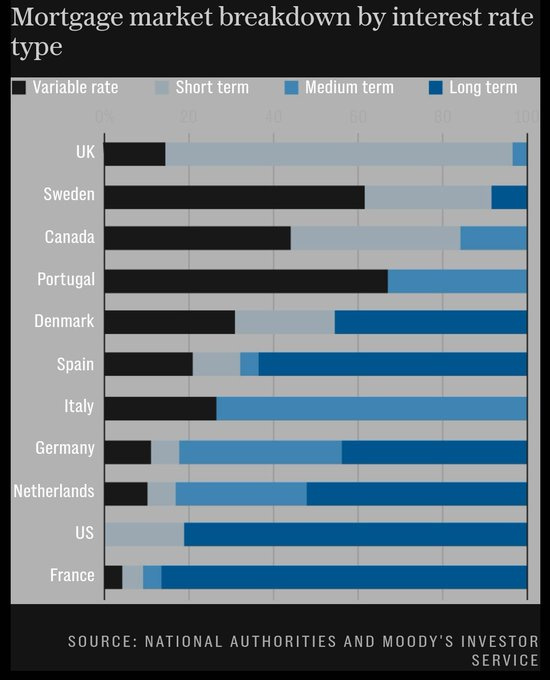
The UK is in a particularly bad place, when compared with the US, as most people have variable rates (tracking Bank of England’s base rate) or short term mortgages (2, 3 or 5 years). Americans tend to have longer term mortgages.
More evidence of the declining prosperity to come in the west.
What examples do you have?


From the Second World War until 1997, if you check any of the indices, house prices nationally were twice average earnings. Since Blair opened the immigration floodgates, this has exploded to 14 times average earnings and climbing. The UK has never built more than 200,000 houses in a year, with it usually around 150,000. Last year the country saw net migration sufficient to fill the city of Liverpool. This year it will be higher, substantially. A new city is simply not built every year. This is why few people under 40 can afford a house, pure and simple. Early 90s, annual net migration was less than 50,000; Conway does not consider this critical difference. Flooding the country with people also depresses wages, especially at the low end. This is well understood yet never raised as a reason for real wage stagnation and the ‘productivity crisis’. Until we are honest about causes, we will not find answers.
Count the number of autos on the road with body damage - especially to the rear of the auto.
Autos with repairable damage mean either the owner pocketed the insurance settlement - or didn't have the money to repair. Repairable body damage is always a sign of economic distress.