Vaccines made no difference to Covid deaths in the Disabled
ONS data, released today, adjusted by vaccination status
Your support is very much appreciated. Please consider taking out a paid subscription to support independent journalism.

Today, the Office of National Statistics (ONS) in England updated their estimates of coronavirus (COVID-19) related deaths by disability status. This looked at deaths between 24 January 2020 and 9 March 2022 for people with self-reported disability status.
The large time span covered meant the analysis could cover whether differences in the risk of COVID-19 mortality between disabled and non-disabled people changed during different waves and over the vaccination programme. The three waves looked at were:
Wave 1 - deaths occurring between 24 January and 11 September 2020;
Wave 2 - deaths occurring between 12 September 2020 and 11 June 2021; and
Wave 3 - deaths occurring between 12 June 2021 and 9 March 2022.
Whilst looking at the relative risk of death involving COVID-19 during each wave, they also adjusted for age, place of residence, geography, socio-economic & demographic factors and health characteristics. It also adjusts for the vaccination roll out, with the second wave being adjusted for first and second doses and the third wave adjusted for all three doses.
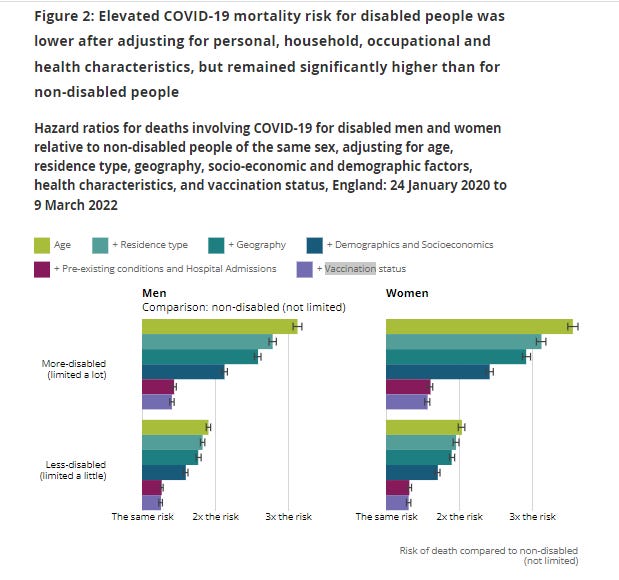
The following chart shows what they found.
First look at the light green bar at the top of each of the four charts. As you can see, when compared with non-disabled individuals, adjusting for age meant more-disabled men had 3x the risk, whilst less-disabled men had under 2x the risk of dying from Covid. More disabled women had well over 3x the risk and less-disabled women had around 2x the risk.
Looking at the next bar down adjusted the risk further by adding residence type. Keep going down and you can see how the risk of dying from Covid changes as different factors are added. Geography, then Demographics and Socioeconomics before the penultimate bar, Pre-existing conditions and Hospital admissions (in red/pink).
The penultimate bar (in red/pink) reduces the more-disabled men’s hazard ratio to around 1.44, less disabled men to 1.27, more disabled women to 1.61 and less-disabled women to 1.32.
So, at this point each adjusting factor (age, residence, geography, demographics and pre-existing conditions) has reduced the risk of a disabled person dying from Covid (when compared with a non-disabled person) as we move down the bar chart.
Next, the final bar in purple. This is where the hazard ratio of death involving Covid-19 is adjusted by vaccination status. If vaccines reduced Covid-19 deaths we would see the bar move to the left as the risk reduced. However, as you can see, for all categories the bar barely moves, if at all.
What this shows, is that for disabled people, being vaccinated did not reduce your chance of dying from COVID-19.
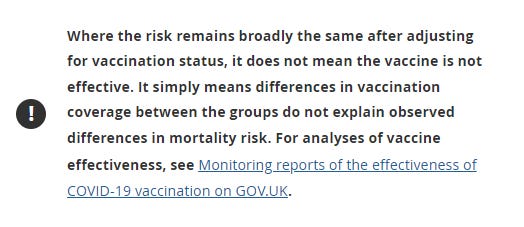
However, as with all statistics nowadays, if anything shows that the vaccines aren’t working as they are meant to, they are either disappeared or come with a proviso. Fortunately, these statistics are still here so come with a proviso instead,
Come on ONS, so because your stats show the vaccine was not effective you have to put a warning label on the stats saying this doesn’t mean the vaccine is not effective.
It seems any statistics that show vaccines work, are 100% bullet-proof but statistics that show the vaccines haven’t worked, are actually just playing tricks with us.
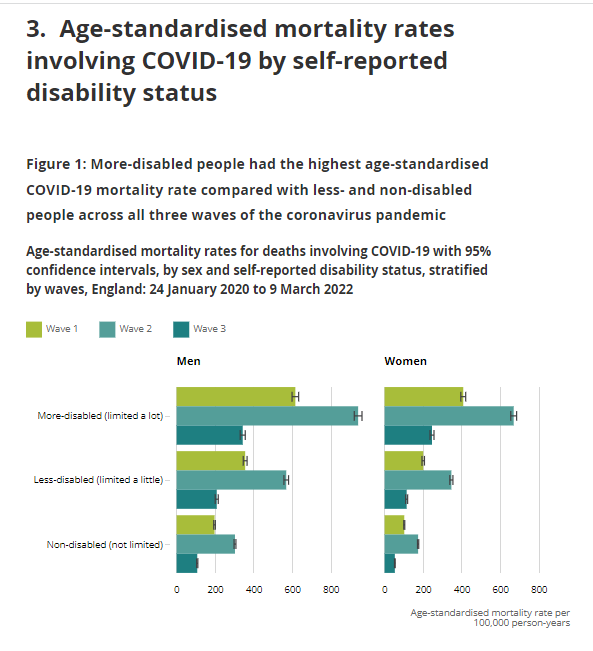
Other data in the publication also showed that age-standardised mortality rates were significantly higher during the second wave (so during and after first and second doses).
Furthermore, the risk of death (versus non-disabled people) barely changed during each wave. If anything, it often got worse.
The elderly and disabled were always the most likely to die from COVID-19 so were vaccinated first (in the UK anyway). This was done, even though relatively few, if any, of the participants during the vaccine trials were elderly or disabled.
At first, only the elderly and disabled were to be vaccinated until vaccine mania swept the globe. The elderly and disabled were protected, so suddenly everyone needed to be protected. And if you didn’t think you needed protection, you needed vaccinating anyway to protect the vulnerable people who couldn’t get vaccinated.
When it turned out the vaccines didn’t stop you getting infected or transmitting the virus, the narrative changed. Suddenly, everyone was in mortal danger and you were a “covidiot" if you didn’t protect yourself. You were told you were much more likely to die if you weren’t vaccinated. Newspapers scoffed at unvaccinated “covidiots” who had tragically died and social media users gleefully re-tweeted the stories.
Turns out, the vaccines didn’t even prevent disabled people, who were more likely to die, from dying. I’m willing to guess that when the same adjustments are made to non-disabled people, the same conclusion will be reached.
*Disclaimer - This is my interpretation of the data. Remember the ONS states that the data they presented to you doesn’t show what they presented to you.


Are we forgetting the NHS took a decidedly eugenic streak when all covid patients got a DNR once in hospital? There was a case where a women with dyslexia saw her chart had a DNR on it!
Classy. But then what do you expect from a socialized service? Can't speak to Canada but we don't get a private care option. it's the State or go to the states (USA) if you got the $.
Well, nice to know now that they utterly and completely destroyed my friend's life. Glad to observe that she wasn't really at elevated risk, after they blew up her transplanted kidney and threw her back on dialysis after 8 years of freedom. I'm so glad she's been plunged into a depression so profound she doesn't feel able to be in touch with me, her friend of 49 years. What's one person's life, anyway, in the scheme of things?