UPDATE - Correlation between Increased Mortality rates and the Vaccination programme in England
Non-Covid deaths
Your support is very much appreciated. My articles and research take up a considerable amount of time and hopefully, with your support, the quality and quantity will keep increasing. Please consider taking out a paid subscription to support independent investigative journalism.
One of the most informative datasets released in the UK is from the Office of National Statistics (ONS) and looks at deaths involving COVID-19 by vaccination status. The reason that it is interesting is because not only does it break down Covid deaths by age and vaccination status but also non-Covid deaths and all cause mortality.
You can read the ONS’ summary here or look at the whole dataset for yourself here.
One of my first articles I wrote on substack looked at this information up to September 2021. I hypothesised that “If the above observations are correct, then with 3rd dose vaccinations under way, we can predict the following: Once the data is broken down by age group, mortality rates will increase as vaccination rates intensify. There will be more all cause additional deaths than COVID deaths and these may be mistakenly categorised as deaths in the 2 dose group, as opposed to the 3 dose group. This mis categorisation may be used as evidence of waning vaccine efficacy and used to encourage people to get boosters.
This latest dataset looks at deaths occurring between 1 January and 31 December 2021, so covers the initial booster rollout. I will look at each age group in turn starting with the eldest.
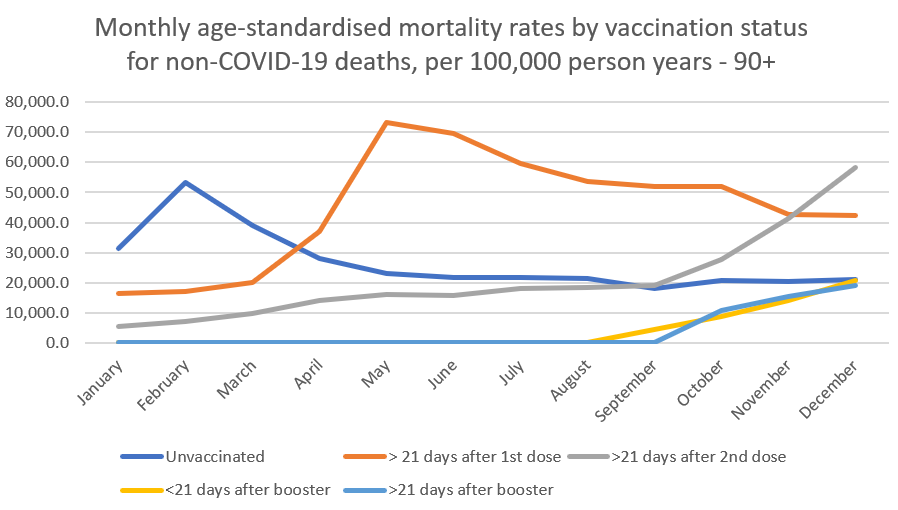
90+
As we saw in the previous analysis, as the first dose vaccination programme peaks in February, unvaccinated deaths (blue line) also peak. As the second dose programme peaks in May, so do >21 days after 1st dose deaths (orange line). Now we can see, as hypothesised would happen in my previous article, as the booster programme begins in September, >21 days after 2nd dose deaths (grey line) begin to rise. We can also see the mortality rate of boosted individuals (yellow and light blue lines) rise but this reaches a par with the unvaccinated mortality rate, so is to be expected.
Why does the unvaccinated mortality rate shoot up during 1st dose vaccinations, they haven’t been vaccinated? Why does the 1st dose mortality rate shoot up after second dose vaccinations, they haven’t had a second dose? And now, why does 2nd dose mortality rates shoot up, as boosters begin, when they haven’t had a booster? There is clearly a mis categorisation issue happening and there is clearly an increase in deaths whenever a new round of vaccinations begin. What other reason would there be for non-Covid deaths to go up just when vaccinations start?
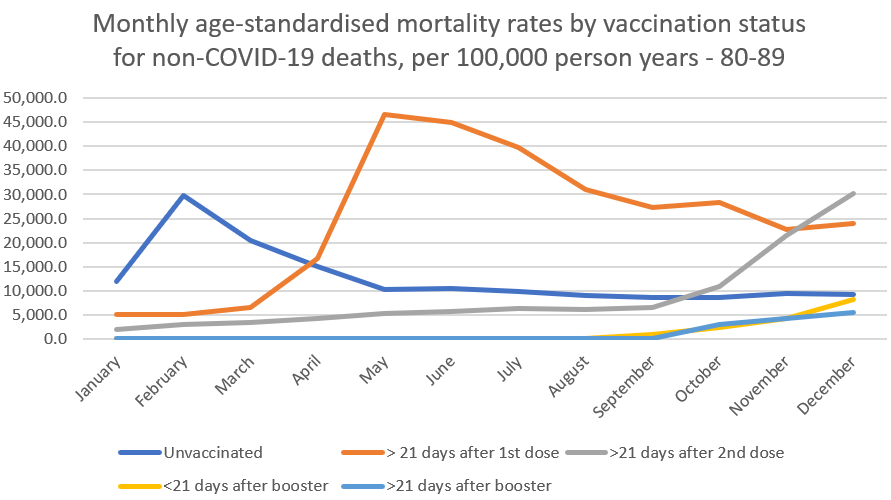
80-89
The same thing happens for the 80-89 age group. Why would non-Covid mortality rates increase just when the vaccination programme begins and peak as it levels off?
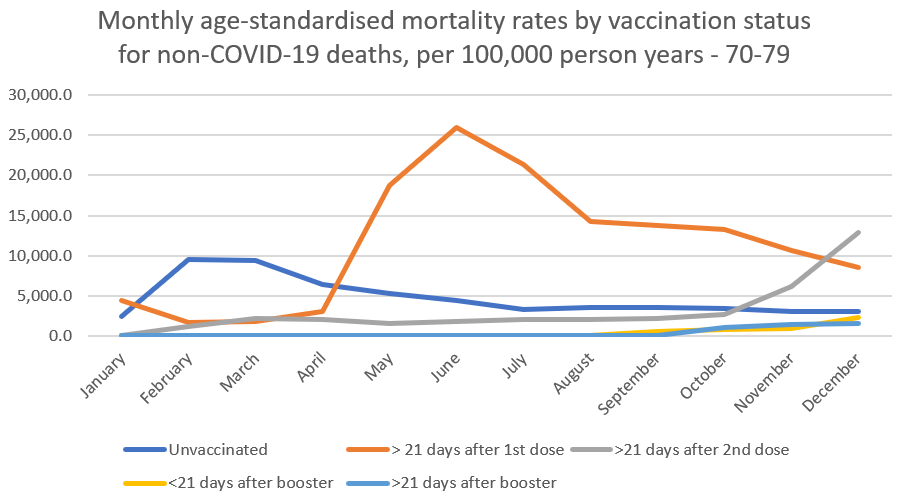
70-79
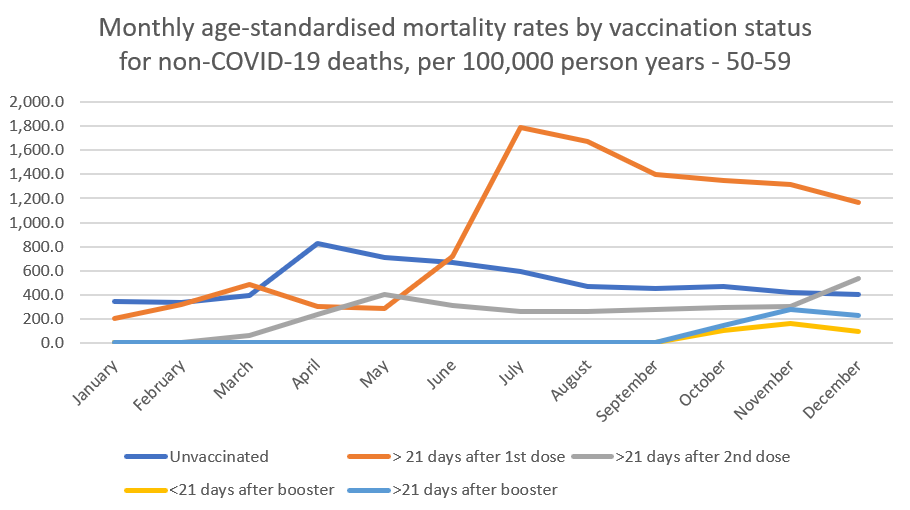
Same thing for the 70-79 age group but the curves are starting to shift to the right as vaccinations start later in the year the younger the age group.
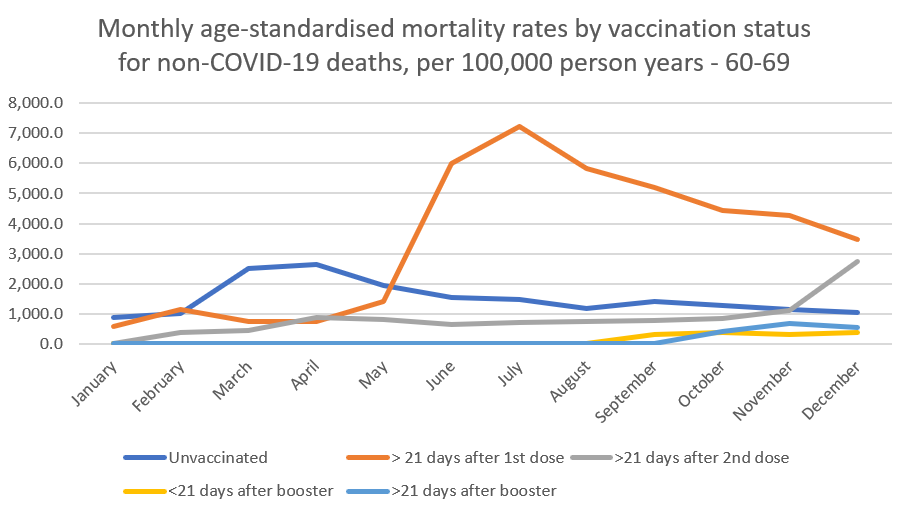
60-69
Again, the peaks are shifting to the right, the later the vaccination programme for that age group begins.
50-59
40-49
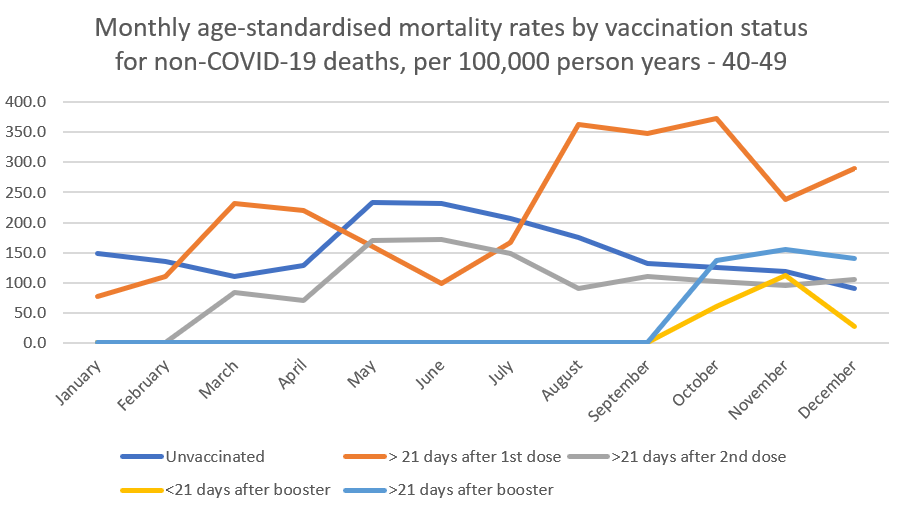
With this younger age group, the pattern is still there but with a few differences. This time there is an early >21 days after 1st dose peak (orange line) coinciding with when the vaccine was rolled out for people with health conditions. There is then a later peak coinciding with the second dose rollout. Most people in this age group had only just had their boosters, if at all, so will barely be showing in the data yet.
18-39
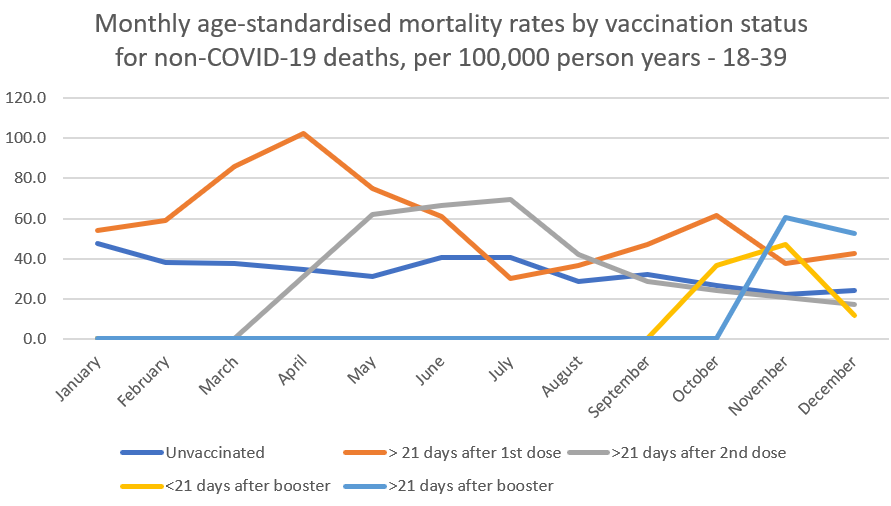
Again with the youngest age group, the pattern is still there but the peaks coinciding with when people with health conditions had the vaccine are most obvious. Clearly, the younger population coped much better with the vaccine, unless they had other health problems. This breakdown in age was not available in my original article and so this pattern was not apparent. As with the 40-49 age group, most people in this age group had not had a booster by December so the uptick in mortality rates is unlikely to be seen until January or February 2022 (although it will be modest as the highest increase in mortality will be those with health conditions and can be seen already in the yellow and light blue lines).
So, my hypothesis from almost two months ago was correct, in so far as there is a rise in non-Covid mortality as the booster campaign began. Furthermore, it seems as though those deaths have been mis categorised as they are showing up in the 2nd dose group (less so in the younger age groups). This group has not had a third vaccination so why else would their mortality rate shoot up?
In the next article, I will look at whether there were more non-Covid deaths than Covid deaths and what patterns can be spotted in that data.


don't know about UK, but in US you are not considered "vaccinated" until 2 weeks after your second jab. Convenient for those "unvaxxed" death stats isn't it?
Thank you! Very logical and convincing, beyond a reasonable doubt. They miscategorize in order to provide the headline "data" so that the further jabs can be pushed, despite their deadliness and harm. Very effective construct. Works every time. No shame, no morals, no principles, no conscience, no fear of God.
This is the logical devolution of atheist societies. Although the proof of the existence of God is simple and indisputable. We know the devil exists. Thence, God must exist too. Q.E.D.