Far fewer all-cause mortality deaths in the unvaccinated than would be expected.
Healthy vaccinee effect or lack of vaccine?
Please consider taking out a paid subscription because it enables me to spend longer reporting on the news that isn’t, but should be reported.
Subscriptions are best but if you would prefer to/ also like to buy me a coffee then click on the button below.
A few days ago I looked at Covid deaths by vaccination status and compared them to the percentage of the population in each vaccination status group. I separated these by age group so as not to encounter Simpson’s paradox and therefore a completely different result to what the data was actually showing.
As promised, today I will take a similar look at all-cause mortality in the various age groups by vaccination status.
All data used is from the Office of National Statistics’ (ONS) dataset - Deaths by vaccination status, England. This provides data on deaths occurring between 1 January 2021 and 31 May 2022.
In May 2022, there was a total of 30,488 all-cause adult deaths in all age groups. Of these 1,011 were in the unvaccinated group. These unvaccinated deaths represent 3.32% of all deaths that month, whilst the unvaccinated adult population is just under 20%.
27,236 deaths occurred in the triple jabbed. This represents 89.33% of all deaths whilst the percentage of the adult population who are triple jabbed is only 64.31%.
On the surface, this doesn’t look great but again, we need to break the data down by age to see what is really going on.
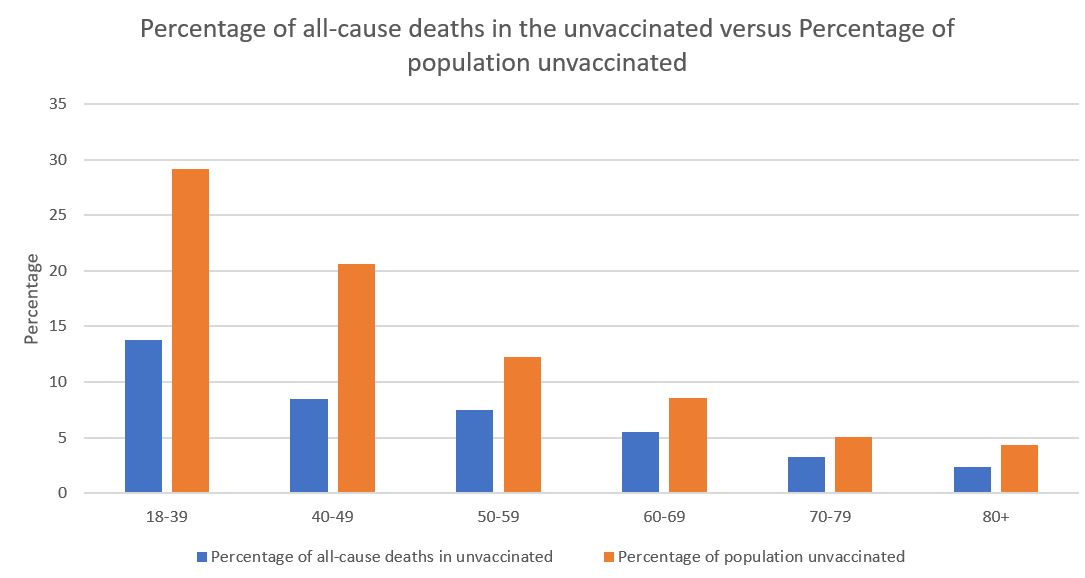
Firstly, the unvaccinated.
In each age category there is a far smaller percentage of people dying from all-causes, relative to the unvaccinated population size. For example, 13.76% of 18-39 year old deaths occurred in the unvaccinated category whilst the actual population size was more than double this at 29.19%.
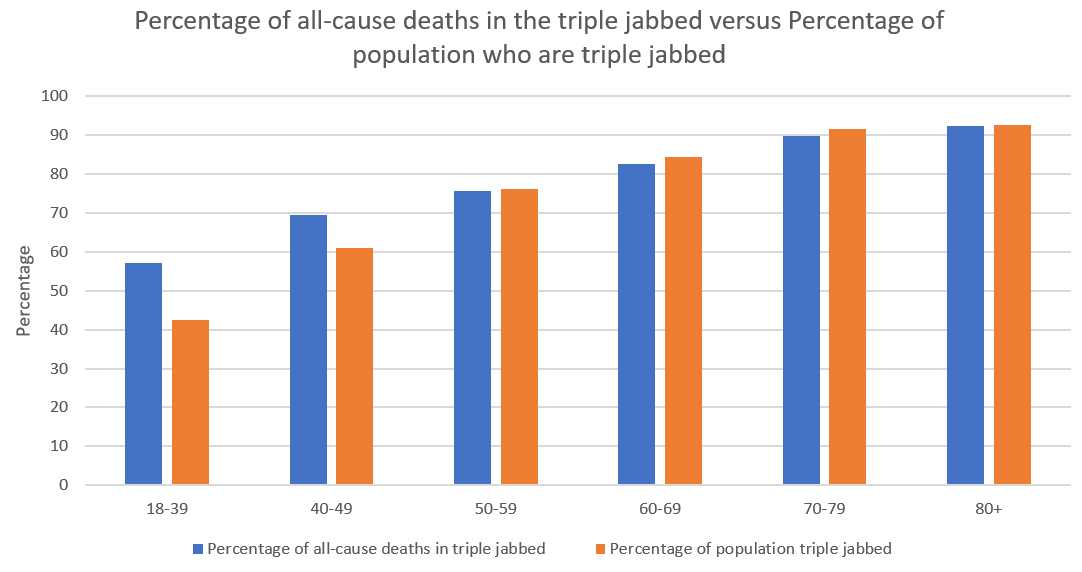
What about the triple jabbed, is the data as worrying when broken down by age?
Only in the younger age groups. 57.14% of all-cause 18-39 year old deaths occur in the triple jabbed but only 42.48% of that age group are actually boosted. Again, with the 40-49 age group, 69.42% of deaths occur in the boosted, whilst only 60.98% of the population are triple jabbed. However, for the rest of the age groups, percentage of deaths almost exactly match the relative population size.
A possible explanation for this could be that in the younger age groups, more healthy individuals decided not to get a booster compared with the over 50s. That created a more unhealthy boosted population who were more likely to die.
If the vaccine is hypothesised as the reason the percentage of deaths is higher, why do we not see the same thing in the older age groups? The younger age groups were jabbed most recently so maybe that is an explanations, in which case I will need to look at the percentages over time. I will do this in another post.
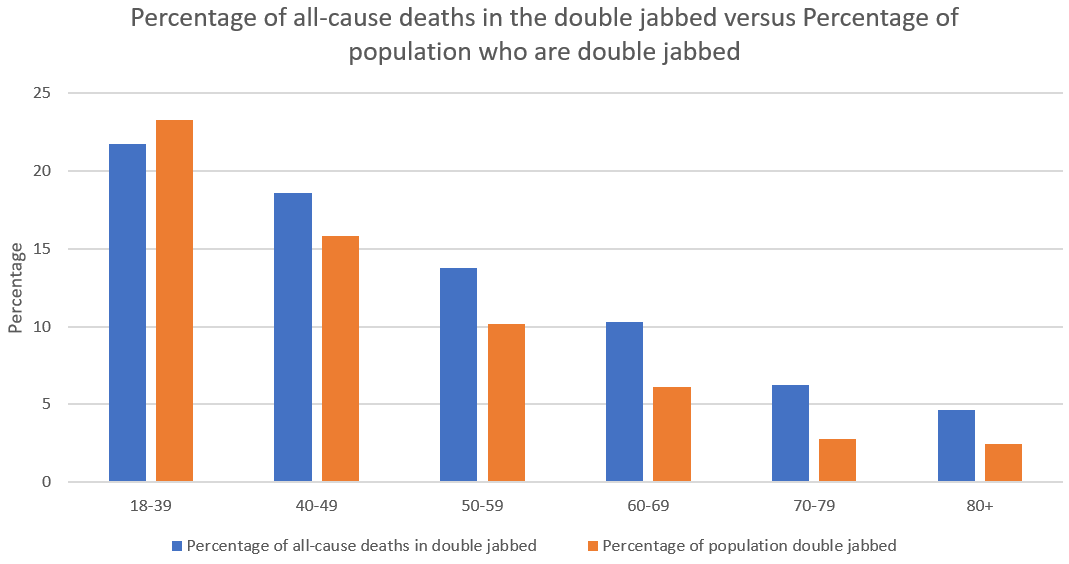
Next a look at the double jabbed.
In all age groups (apart from 18-39 year olds), for the double jabbed, there is a higher percentage of deaths than the relative population size. Again, does this show unhealthier people decided not to be boosted and therefore left an unhealthier population in the double jabbed category? This is not the case for the 18-39 year age group. There are fewer deaths than the relative population size. Is the reason given above inverted for the younger age groups, in that the unhealthier individuals are more likely to be boosted leaving a healthier two dosed group?
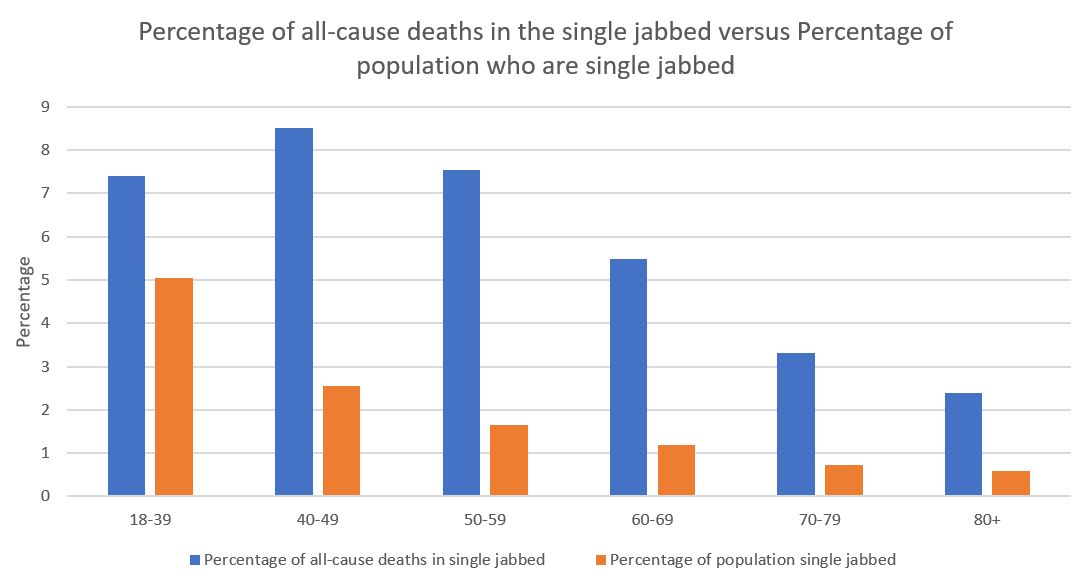
What about the single jabbed?
This time, it is very clear that the people left in the single jabbed group are much unhealthier and therefore die at a higher rate than their relative population size would suggest. The pattern occurs in all groups with the smallest difference in the 18-39 year olds.
To summarise, when looking at all-cause deaths the unvaccinated are dying at a much lower rate than their population size would suggest. Strangely, the same is true for double jabbed 18-39 year olds. The rest of the age groups in the double jabbed and single jabbed categories are dying at higher rates than their population size would predict.
When it comes to the triple jabbed, all age groups over 50 are dying at similar percentages to their population size. However, more triple jabbed under 50s are dying than the percentage of people in that population.
Can these results be explained by the healthy vaccinee effect? I would say, some of them probably can be. Has the vaccine had any effect on all-cause mortality? I don’t think we can answer that by looking at just this one month. I will therefore have to work out vaccination rates in the population over time and have a look at how death rates have changed. I will do this over the next few days and post the results in a new article.
Subscriptions are best but if you would prefer to/ also like to buy me a coffee then click on the button below.


Thank you. ACM, my fav stat :)
In Canada they have stopped reporting the vaccination status of dead people for some strange unbeknownst reason. I wonder why .... ?
Keep Fighting!
Maybe the triple jabbed looks better because of what the bad cat calls Bayesian data crime. In other words all the deaths within 14 days of taking the 3rd jab actually fall into the double jabbed bucket.