Your support is very much appreciated. Please consider taking out a paid subscription to support independent journalism.
Reuters Fact Check recently published a fact check on a graph that you may have seen.
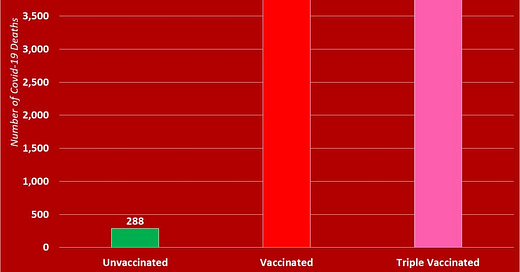
The chart shows “the number of COVID-19 deaths by vaccination status in England between April 1 and May 31. It reveals that 94% of deaths in that period were among those who are vaccinated.”
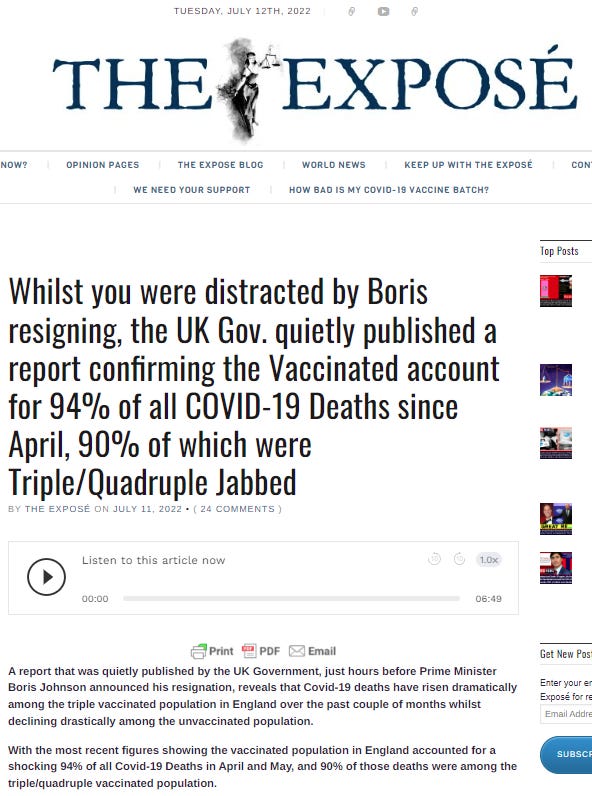
It originally came from a website called “The Expose”.
Reuters Fact Check says “this statistic on its own is misleading as it fails to acknowledge the nation’s vaccination rate.” Their verdict is this is “Misleading”. “A spokesperson for the Office for National Statistics told Reuters via email: “Looking at the proportion of deaths among the fully vaccinated without accounting for the vaccination rate is highly misleading. For instance, if everyone were vaccinated, 100% of people would die vaccinated.”
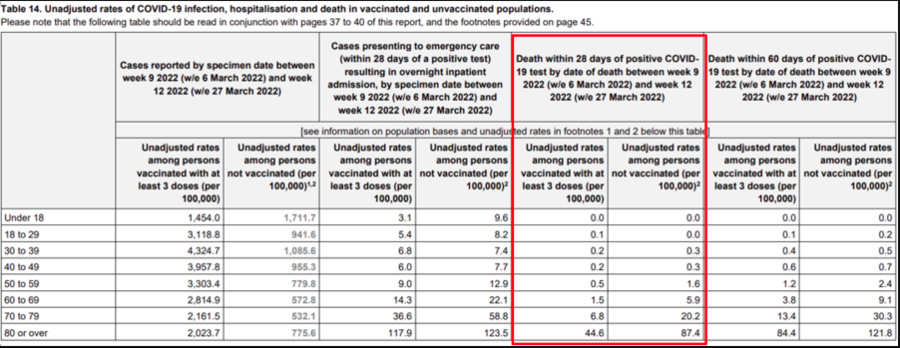
Lead Stories also fact checks the chart. They come up with the same figures as The Expose but again say the conclusion is misleading. They quote the UK Health Security Agency who say “The important statistic here is the rate of death for each group. Percentage wise, the proportion of deaths remains higher in those who are unvaccinated, compared to those who are vaccinated. Table 14 on page 45 of the report shows the rate of death per 100,000 people, split by age. As you can see, in every age group (barring in this report the very low numbers in the 18-29 age group under the 'deaths within 28-days' column), the rate of death is higher in those who are unvaccinated, compared to those who are vaccinated with at least three doses.”
However, this in itself is misleading because they are using death rates from March to compare with deaths in May.
So what is going on? What is the truth? All data is from the ONS’ publication “Deaths by vaccination status, England”. So you can check it yourselves.
Firstly the number of deaths.
The Expose say that between 1 April 2022 and 31 May 2022 there were 288 unvaccinated deaths. This is correct.
The Expose also say 4,647 ‘ever vaccinated’ individuals died during the same time period. Again this is correct. So the unvaccinated represent just under 6% of deaths.
Finally, they claim that triple vaccinated individuals account for 4,215 of the deaths (85%). Again, this number is more or less correct (Under 3 death counts are reported as <3, so the exact number is uncertain). Furthermore, this number is the number of deaths in the ‘third dose or booster, at least 21 days ago category’ so doesn’t include booster deaths less than 21 days after vaccination (however, these are relatively few).
So the numbers of deaths are correct but what about the ‘misleading’ claim?
Yes, you could argue that this is misleading. Simpson’s paradox “is a phenomenon in probability and statistics in which a trend appears in several groups of data but disappears or reverses when the groups are combined”. Looking at the data as a whole could certainly produce the incorrect conclusion.
There is only one way to sort this out. Break the data down by age group and compare with the percentage of that population who are vaccinated.
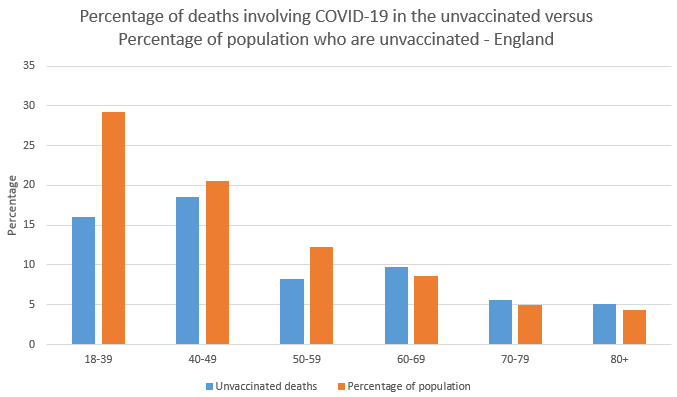
Firstly looking at the unvaccinated population.
As you can see, 16% of deaths involving COVID-19 are in the unvaccinated 18-39 year old age range. However, 29.2% of the population in that age range are unvaccinated meaning there are far fewer deaths than there should be. This trend remains the same for 40-49 and 50-59. In the over 60s the percentage of deaths is slightly higher than the population size but only about 1% higher.
So, we can conclude that under 60s have a lower chance of dying if unvaccinated and for over 60s the amount of deaths is roughly equal to the population size.
Next triple jabbed deaths.
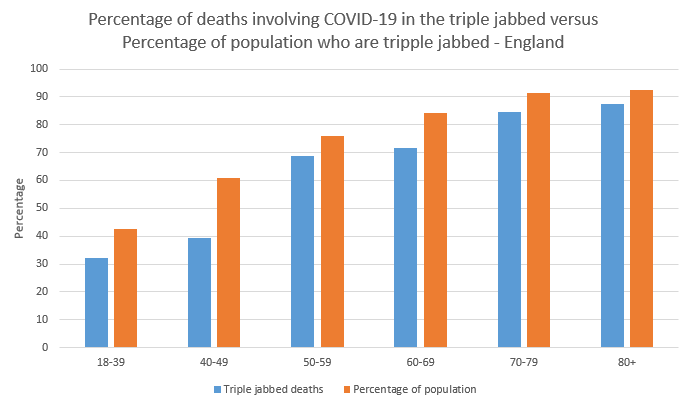
This time, with the triple jabbed, the percentage of deaths in each age group is lower than the percentage of triple jabbed people in the population in every age group. This is being slightly generous because it only includes >21 days since being jabbed instead of <21 days as well. However, most of the deaths are in >21 days so it won’t make too much difference.
So there are fewer deaths in the unvaccinated and triple jabbed when compared with their population sizes. What does this mean? It must mean there are more deaths in the one and two jabbed categories. This could be because healthier people decide not to get vaccinated or continue from jab to jab without any problems whilst the unhealthy stop jabbing due to ill health. Or it could mean than if you don’t continue getting jabbed, you become more susceptible to Covid. Or a combination of both.
So, let’s take a look at one dosed individuals.
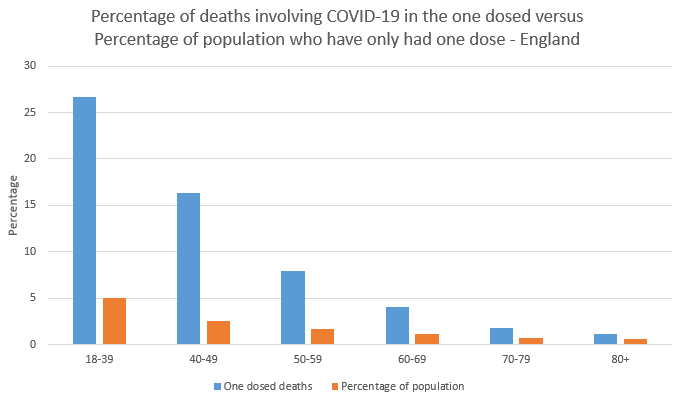
Yes, my hypothesis was correct, the percentage of deaths in the one dosed is far higher than their population size. This applies to all age ranges.
Is the same true for the two dosed?
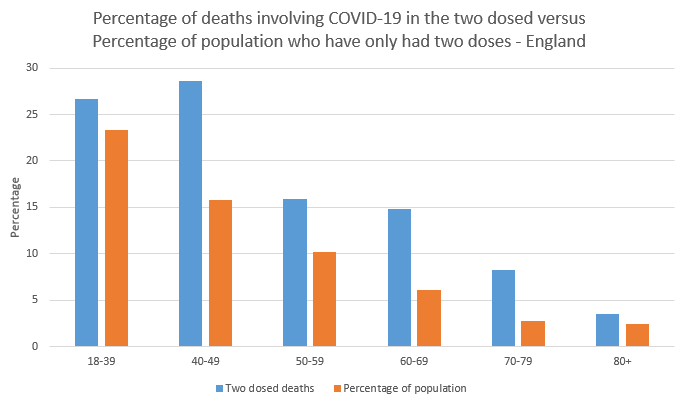
Yes it is. Percentage of deaths in this category is far higher in all age groups.
So whilst the Expose’s figures were correct, they were wrong to focus on the triple jabbed. The fact checkers were correct in saying that because a large proportion of the elderly are triple jabbed, you can expect a large proportion of deaths. They were correct in saying the figures should be broken down by age.
However, when broken down by age, we get the concerning statistics that one and two dosed individuals are far more likely to die of Covid. Is this an unhealthy population? Probably. But are boosters needed to continue protection before vaccine efficacy goes negative? Possibly. Certainly something that needs further looking in to.
Tomorrow, I will do a similar analysis on all-cause mortality to see if the percentage of deaths tallies with the population size.



Regardless, shouldn’t we be seeing almost no deaths in jabbed categories? I mean if they truly functioned as a vaccine there should be a handful of unlucky souls who got a break through infection, maybe a few misdiagnosed deaths ie. people dying of Covid when they did not. If they truly worked we should see like 99% of all deaths in the unjabbed.
It is a bit more complicated than this.
(1) The anti-bodies make no sense, since the Wuhan variant does no longer exists. So we can not expect any protection. According to Bossche we can even expect negative protection. (2) Side-effects from the vaccine are often counted as Covid. (3) The vaccine status often has a 14 day delay. (4) Depending on the vax-status, the tests are performed differently. Vaxed are sometimes not even tested, while unvaxxed are treated as rats. In the US the PCR-count has been reduced from 45 (99% false positives) to 28 (30% false positives). And this PCR test can be positive with a different infection (like a cold). (5) Racial and wealth differences. Many poorer communities avoided the vax, because they had bad histories with them. (6) Differences between batches. The conservative states were sent the more toxic batches it seems. (7) Many cities and states already had herd immunity (in spring 2020) before the vax was introduced. (8) The governments and agencies are actively looking for stats to make the unvaxed look worse. Often making up "facts". (9) Certain communities have access to cheap medicine that actually work, and/or better food. (10) Deaths from guns and accidents (anything) may also be counted as covid deaths when a test turned out to be positive. Families and doctors were bribed to put covid on the death certificate. And not to put vax death on the death certificates.