Your support is very much appreciated. Please consider taking out a paid subscription to support independent journalism.
And today, for one day only, because we are discussing inflation, there is going to be a deflationary shock for new paid subscribers. Make sure you sign up today to take advantage of this offer (I really should work in advertising).
or subscribe at the full price to help fund this newsletter.
The Office for National Statistics (ONS) in the UK produce some excellent data which I have analysed before. Yesterday they released their updated data looking at deaths by vaccination status in England between 1 January 2021 and 31 March 2022. This includes age-standardised mortality rates for deaths involving COVID-19, non COVID-19 deaths and all deaths by vaccination status, broken down by age.
In this latest release they included a new table which looked at registered deaths grouped by how many weeks after vaccination the deaths occurred.
In this article I’ll look at COVID-19 deaths and non-COVID-19 deaths in the next article. If vaccines didn’t cause any COVID-19 deaths, I would expect that the number of deaths in each week after vaccination to be relatively similar. Why would there be more deaths, on average, in one week over another?
So straight into the graphs.
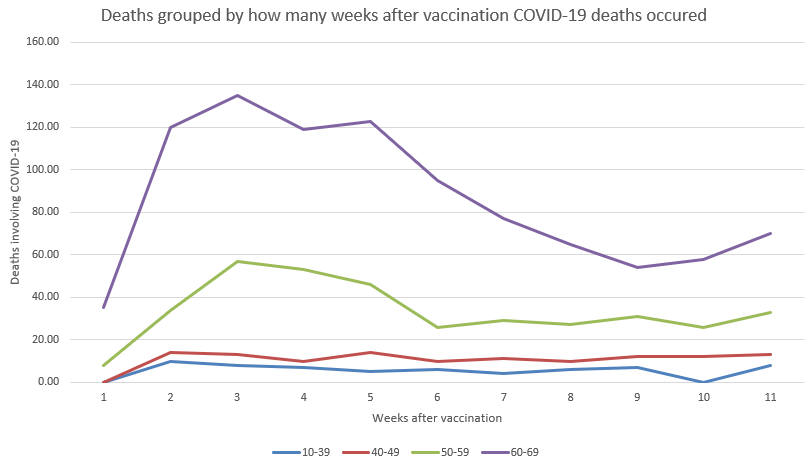
I would expect the lines to look like the blue and red lines. These are for 10-39 and 40-49 year olds. Clearly, the vaccines are not having an impact on COVID-19 deaths in under 50s. The lines are fairly consistent, however many weeks after vaccination.
Moving on to the green (50-59 yr olds) and purple (60-69 yr olds) lines. Now, there are clear peaks occurring, three weeks after vaccination. After three weeks, the number of deaths begins to fall before a slight uptick at around nine or ten weeks.
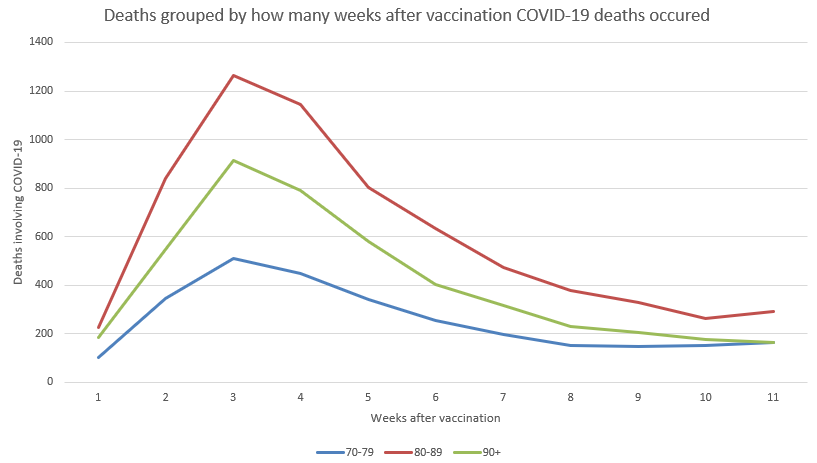
The next chart looks at the older age groups.
Again, there is a clear and more obvious peak at three weeks after vaccination. This then falls back down before starting to increase, again at 10 weeks.
Why are we seeing peaks at three weeks after vaccination if vaccines had no effect on COVID-19 deaths? Is this showing the vaccines having an immunosuppressant effect on individuals which peaks on week three? Or are the vaccines producing symptoms identical to COVID-19 which intensify over three weeks before being recorded as COVID-19 deaths.
Could there be other explanations? The first one I can think of is the healthy vaccinee effect. You are unlikely to go and get vaccinated if you are ill so you would be less likely to have SARS-CoV-2 in your system on your appointment date. Therefore, you would not die of COVID-19 in the first few weeks after your injection. You then get overconfident, catch Covid the week afterwards and die two weeks later. Antibodies from the vaccines, in the people who don’t die at week three increase and so numbers of deaths drop. Then at week 10, the vaccine begins to wane and deaths start to rise again.
I don’t buy this explanation because I don’t think you would see such a consistent peak at week three in all the age groups. But, if this does turn out to be the explanation, then it shows that the vaccines were completely pointless for under 50s. The graphs for the under 50s don’t show any drop in deaths once the vaccines were supposed to have given full protection.
It’s this persistent week three peak that is interesting. Taking a look at the usual stages of COVID-19 before death we see mild symptoms starting on day one before progressing to something more serious at day ten. The median day to be admitted to ICU is day 12. Kidney and cardiac injury usually occurs on day 15 before median time of death occurring on day 18.5. How many weeks in 18.5 days? Almost 3 weeks. This suggests that vaccination is causing more COVID-19 deaths.
However, it may not be the vaccine itself. Vaccination centres are excellent superspreading events. Perhaps insisting that old and vulnerable people be wheeled off to the local vaccination centre, full of other potentially ill people, was not the greatest of ideas. Perhaps the vaccination centres gave people COVID-19 and they then died three weeks later?
I am trying to think of other explanations and arguments. The final devils advocate argument I can think of is that most COVID-19 deaths would have occurred at similar times, at the peak of waves. However, if this was the reason for the peak in the graphs, we should see the peaks occurring at different points in time depending on the age group. This is because different age groups were vaccinated at different times.
No, the fact that there is a clear peak at week 3 in all the age groups says to me that either the vaccines or the vaccination centres were causing people to catch SARS-CoV-2 or similar symptoms and subsequently being registered as COVID-19 deaths.


This backs up the Alberta data that was suppressed last year, 47% of Covid deaths in vaccinated people happened within the first two weeks. This could be either immune suppression or the vaccine itself- spike protein induced cytokine storm. They’ve had this data for up to a year, just releasing it now when it doesn’t make a difference.
Vaccination centres or countries with testing lines couldn't have contributed. Everyone there was masked.