Your support is very much appreciated. Please consider taking out a paid subscription to support independent journalism.
Before I even start, obviously the headline is extremely misleading, there weren’t 69,466 deaths in England due to vaccines. You need to read the subtitle ‘* within 28 days of positive vaccination’ for some context. However, these are the kind of misleading stats that were produced daily to scare the public and justify damaging lockdowns.
So, playing the propaganda machine at its own game, there were indeed 69,466 deaths in England, within 28 days of COVID-19 vaccination. This data comes from the Office of National Statistics (ONS) in the UK which looked at deaths in England, grouped by weeks after vaccination, between 1 January 2020 and 31 March 2022.
During the same time, there were 80,003 deaths within 28 days of a positive COVID-19 test. Very similar numbers. Imagine the uproar and ridicule there would be if it was suggested in the MSM that vaccines had caused all these deaths and that we need to shut down the economy because of it. I know there are differences in my comparison but hopefully you get the gist.
If we look at deaths within 60 days (which is also the metric that is still reported) there were 167,942 deaths after vaccination. (60 days covers 8.5 weeks so I divided the amount of deaths in week nine by two). This compares with 101,210 deaths within 60 days of a positive COVID-19 test. Again, imagine the uproar if a MSM headline read ‘Over 50% more deaths from vaccines compared with COVID-19’.
I’ve covered COVID-19 deaths after vaccination so I will now take a look at non-COVID-19 deaths by age group. One snippet of information I wanted to add about COVID-19 deaths was the explanation given by the ONS.
“Low counts of deaths in the first few weeks after vaccination are indicative of the healthy vaccinee effect, whereby people are less likely to get vaccinated (more likely to delay vaccination) if they are in poor health or unwell. This effect will be explored in future publications. The low counts of deaths involving COVID-19 in the first few weeks post-vaccination are offset by the decreased protection from vaccination. After three weeks post-vaccination, the counts of deaths involving COVID-19 decrease, which is indicative of the protection from vaccination”
To me this is admitting that vaccination actually increases the chance of getting Covid - “the first few weeks post-vaccination are offset by the decreased protection from vaccination” but maybe I’m reading it wrong? If they are trying to say the vaccines don’t provide protection until week three then wouldn’t they say “are offset by the lack of protection”? The word ‘decreased’ seems strange to me.
Next, I want to look at the explanation given by the ONS regarding non-COVID-19 deaths (emphasis my own).
“After three weeks post-vaccination, the counts of deaths involving COVID-19 decrease, which is indicative of the protection from vaccination, whereas the counts of non-COVID-19 deaths plateau.”
So when I look at non-Covid-19 deaths I should find deaths plateauing after week 3. And this is because mainly healthy people get vaccinated so deaths are lower around the vaccination date.
Let me just check the definition of ‘plateau’ before I start. From the Merriam-Webster dictionary:
“Definition of plateau:
a region of little or no change in a graphic representation
a relatively stable level, period, or condition”
Now the data in graph format, first for 10-39 and 40-49 year olds.
You could argue that deaths in the 10-39 age group plateau, but not until week four. However, in the 40-49 age group, deaths continue rising until week 7 before dropping. Admittedly, the rate of growth slows after week 3 but it is still on an upward trend.
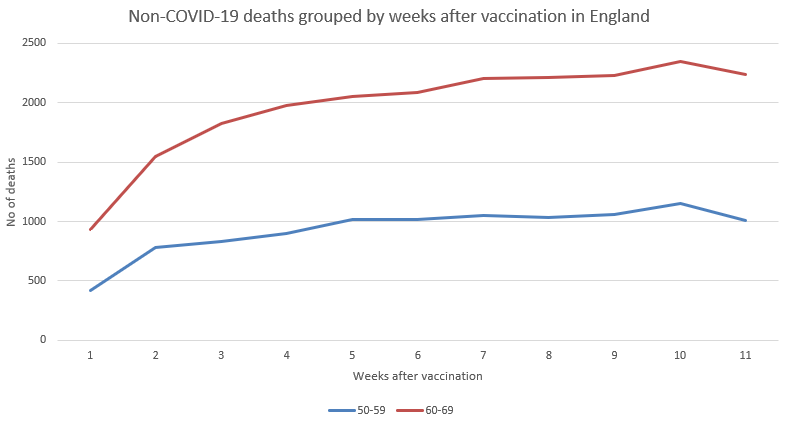
Next the 50-59 and 60-60 age groups.
Again, the rate of increase slows but I still wouldn’t call it plateauing. Number of deaths increase until week 10 for both age groups here.
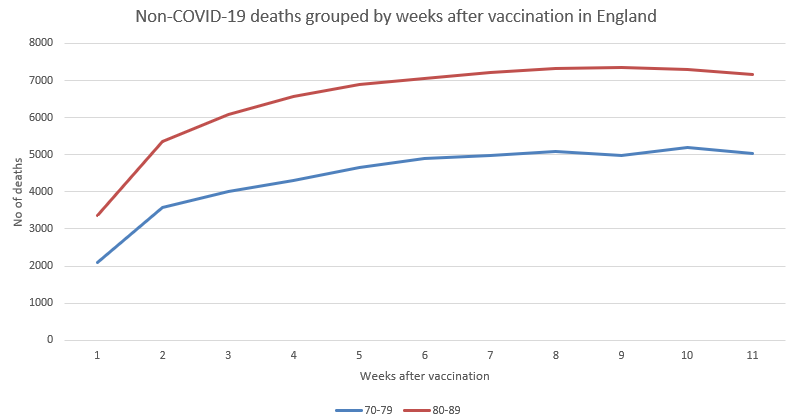
Same thing with these two age groups. Rate of increase slows after week 2 but the amount of deaths increases until week 9 and 10.
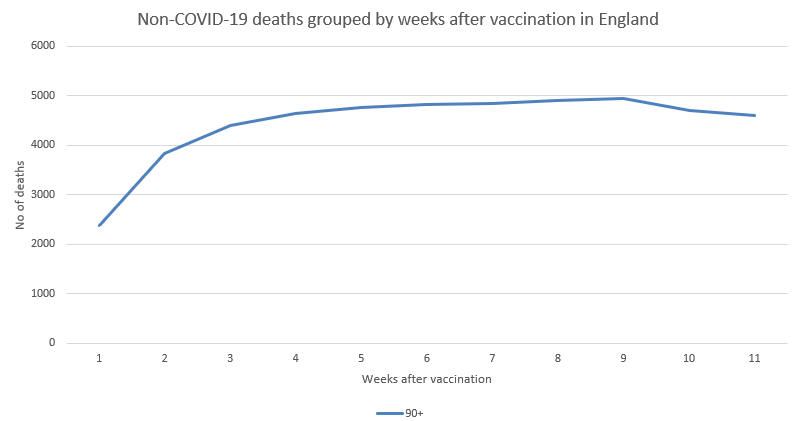
Finally the 90+ age group.
You could perhaps says this graph plateaued after week 3 but number of deaths still did not peak until week 9.
Maybe I’m just splitting hairs over the wording used. However, whatever definition you want to give the line of the graph, the fact of the matter is numbers of non-COVID-19 deaths increased quickly until week 2 or 3 but then continued to rise until week 9 or 10. Make of that what you will.
One last observation from this dataset is in the Notes section. Note 17 says (again, emphasis my own):
“There were 2,044 people who were vaccinated but not included in the NIMS data as they died soon after vaccination. Of these, 1,393 linked to our Public health Data Asset dataset. We included the latest vaccination records for these people in our dataset. This data is provisional and extends up to the 15 February. This will be updated in future releases.”


“There were 2,044 people who were vaccinated but not included in the NIMS data as they died soon after vaccination."
Why the heck were they not included?
That’s why I don’t read any corporate media news, including any charts, statistics, graphs, etc. it’s all bullshit.