Your support is very much appreciated. Please consider taking out a paid subscription to support independent journalism.
Subscriptions are best but if you would prefer to/ also like to buy me a coffee then click on the button below.
Excess deaths in England and Wales have been consistently high for months now. The latest week of data (5 August 2022) shows 1,350 excess deaths which is 14.4% higher than the 5-year average. Only 6.8% of these are involving COVID-19, even fewer directly caused by Covid.
However, these are deaths in all ages and I was curious to find out where the increases are coming from. In previous years, after a bad flu season, you would expect fewer excess deaths due to deaths being pulled forwards. So why are we seeing so many excess deaths after Covid and in the middle of the summer?
For this analysis I used the “Deaths registered weekly in England and Wales, provisional” datasets, compiled by the Office of National Statistics. I have used the figures from 2015-2019 to provide a five year average with which to compare as 2020-2021 are too disjointed.
First the good news. For children, there are no excess deaths. So far this year, under 1s are almost 12% under the 5-year average and 1-14 year olds are 2% under average. In fact, over the period I am looking at in this analysis (up to week 31), under 15 deaths were below average in 2020 and 2021.
However, these are the only below average age groups.
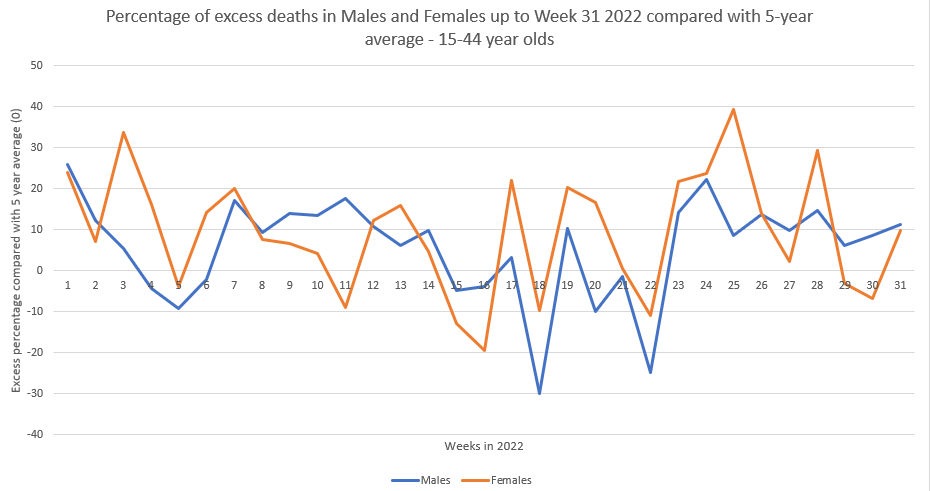
15-44
The next age group, 15-44 year olds, have excess deaths of almost 7% above the average so far this year. This is just over 600 more individuals dying than would be expected. Week 31, on its own, is close to 11% above average and in recent weeks it has reached 22% and 19% before dipping back down again.
When separated by sex, women fare worse than men. For the year so far, men are 5.4% above average whilst women are over 9%. In recent weeks women have reached 29% and 39% above average.
The trend for this age group looks flat which suggests, unless anything changes, excess deaths will remain at this level for the foreseeable future.
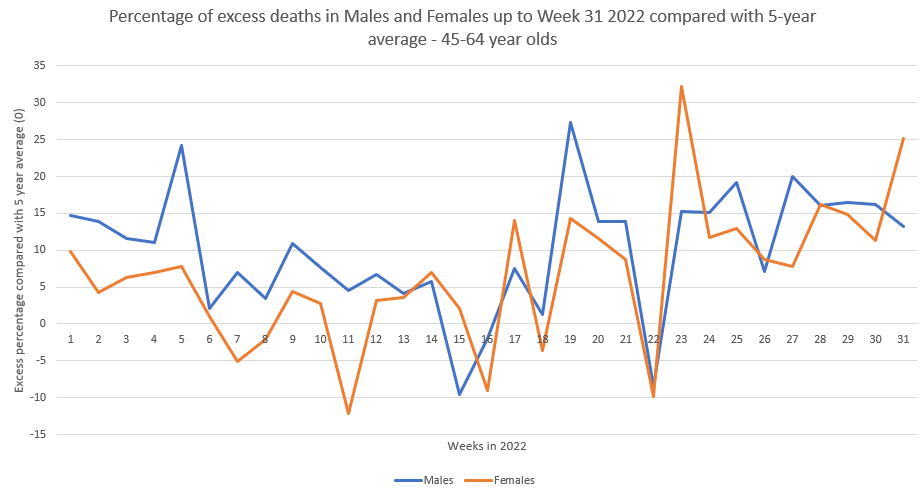
45-64
In the 45-64 age group, excess deaths are at 8.6% higher for the year. This represents almost 3,300 additional deaths. However, for individual weeks that number is worse and in the latest week has reached 18% higher than the 5 year average. For females it is even worse with the latest week showing an excess death rate of 25%.
This time, the trend was downwards until mid-April (week 15/16), at which point the trend changed and is now firmly upwards. There may be a suspicion that this was due to the spring booster but, in the UK, this was mainly given to those aged 75 and over.
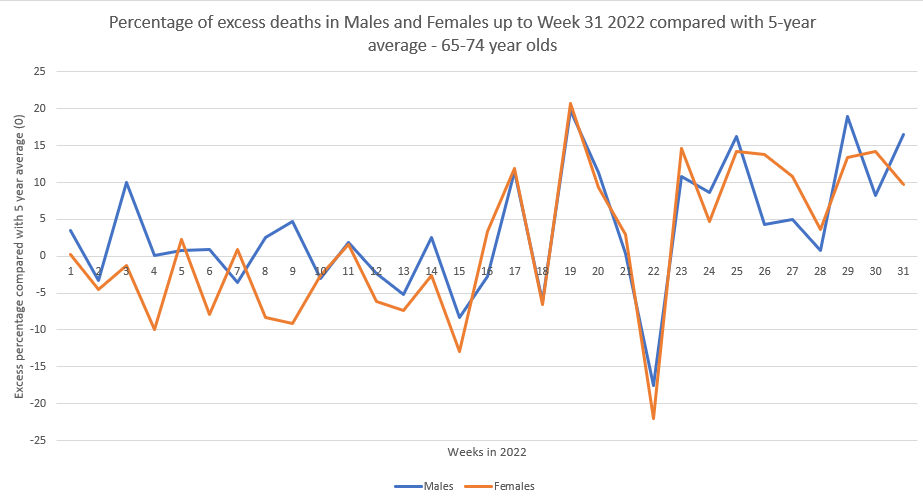
65-74
Cumulatively, this age group has one of the smallest excess death rates at 2.5%. This represents an addition 1,300 deaths. However, as before this is on the rise with the latest week showing 13.5% excess deaths. For males, the latest excess death rate is 16.5%.
The trend has again been rising since mid-April when the rest of the year it was reasonably flat.
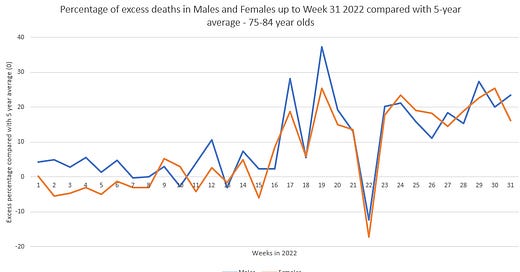
75-84
In this age group there has been an excess death rate of around 8% over the year. This represents around 7,400 additional deaths. But as with the previous age groups, this has been on the rise. In the most recent week, this has reached an excess of 20% with males worst off with an excess of 23.5%.
Once again, the trend has been very firmly up since early April.
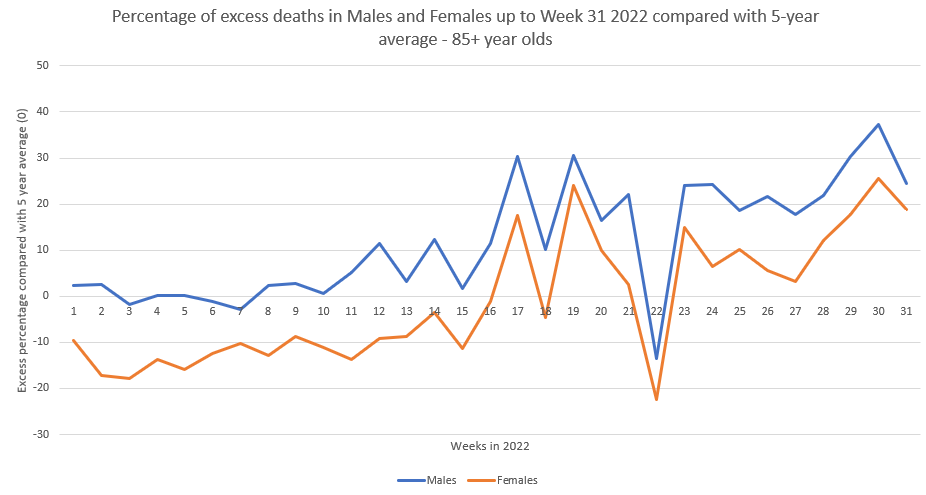
85+
This age group has a similar cumulative excess death rate as the 65-74 years olds at 2.5%. For the year, this results in approximately 3,200 additional deaths. However, to show how many recent excess deaths there have been, up to mid April there were -4,784 excess deaths. Almost negative 5,000 excess deaths. Since then there have been almost 8,000 excess deaths.
Once again, the trend is upwards and has been since mid February.
So far this year we have seen approximately 15,783 excess deaths in over 15 year olds. However, if we start from mid-April, there have been almost 19,200 excess deaths.
What is most concerning is that the trendlines are either rising or flat, indicating that the amount of excess deaths will rise week by week unless something changes. And going into the Autumn and Winter this change is unlikely to happen.
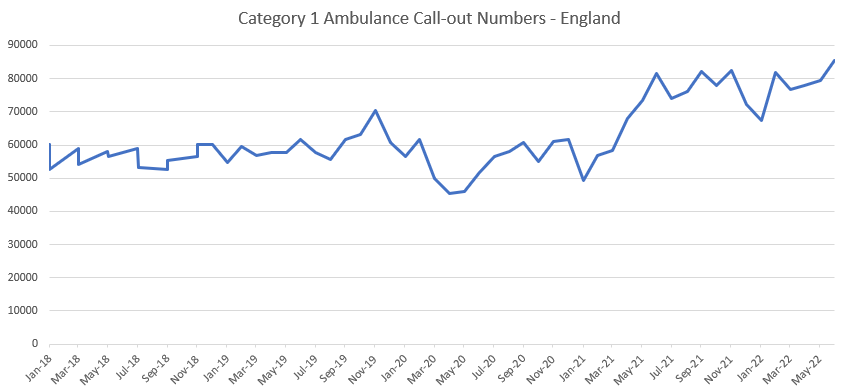
This is also evident in the ambulance data. Overall, until around April 2021, category 1 ambulance call-out rates were relatively flat at around 50,000-60,000 per month. (There was a peak of around 70,000 in December 2019, which as I have argued before, could indicate that Covid was in the UK much earlier than stated and peaked months before the Government decided to panic everybody).
Category 1 call-outs are the most serious call-outs and require an immediate response to a life threatening condition , such as cardiac or respiratory arrest.
In April 2021, something changed and these serious call-outs quickly reached 80,000. Since then numbers have oscillated between 70,000 and 80,000 call-outs per month but have not dropped back down to their long term average. In fact, the latest month of July shows another sharp increase up to 85,397.
What is causing this increase in serious ambulance call-outs and excess deaths? Some of this is Covid related but I thought the vaccines were meant to stop this? There is no doubt that lockdowns are one of the major causes but it would be stupid to not even consider vaccines. Investigate whether they have contributed to these excess deaths in any way, present the evidence and then say no they haven’t. But don’t just dogmatically say they are safe and not look into it.
Why, did ambulance rates only start rising in April 2021, a full year after the first (supposed) Covid peak and lockdown? Why have excess deaths been rising so rapidly since April this year?
Questions which the government don’t seem to be interested in looking at - I wonder why (sarcasm)? But if they don’t start getting some answers these numbers will only continue rising, especially into the Winter.
Subscriptions are best but if you would prefer to/ also like to buy me a coffee then click on the button below.




Personal experience. Paramedic in Liverpool UK. It’s off the scale
Ive been doing the exact same analysis in New Zealand. Over the padt 10 weeks, the average weekly death rate is 836, with records set in two of the last 3 weeks. The five year average leading up to the pandemic, from 2015 to 2019, was 642. The rate of increase is accelerating, thanks in part to winter effects, but we have never had a 950 figure like we had at the end of July. There have been over 6000 more deaths in the 65 weeks since the vax rollout, than in the previous 65 weeks (41K v 47K), an increase of 14%. This is matched in Australia also.