In normal times (will we ever return to those?) I would report on surges in excess deaths as soon as they happened. Sadly, they are happening every week now, so I don’t write about them each time. But today I will.
Week 26 in England and Wales saw 918 excess deaths which is 9.7% above average. On its own, Wales was 19.3% above average. However, this is using the Office for National Statistics’ (ONS) new five-year average which includes the pandemic years (for 2023 they compare with 2017-2019 & 2021-2022 and for 2022 they compare with 2016-2019 & 2021).
So, if we remove the pandemic years and use 2015-2019 as the five-year average we get 1,078 excess deaths this week.
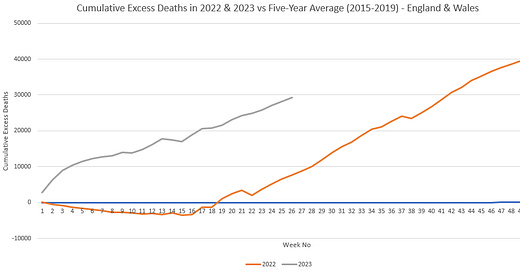
Worryingly, 2023 is looking far worse than 2022. We are close to 30,000 excess deaths already this year, compared with approximately 7,700 this time last year.
This is best visualised in the graph below with the orange line representing 2022 and the grey line, 2023.
If we continue at this rate, there will be approximately 70,000 excess deaths this year.
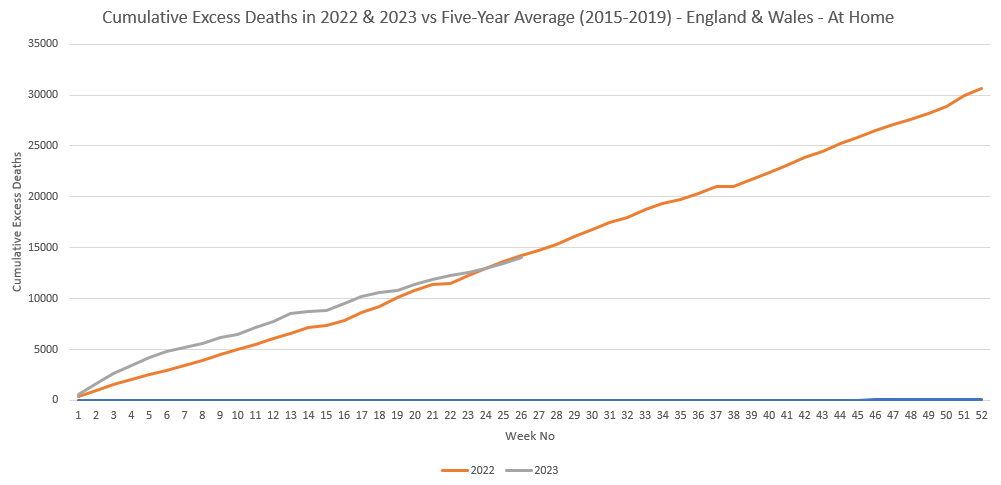
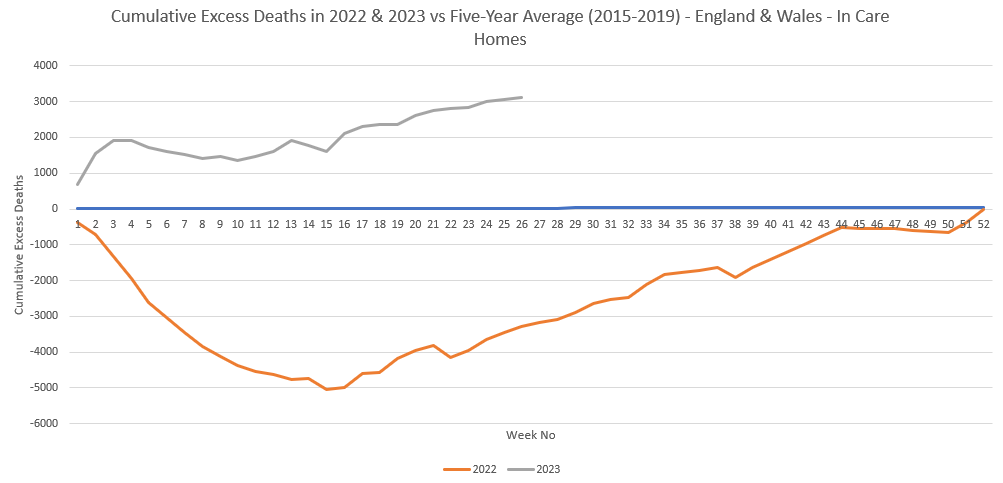
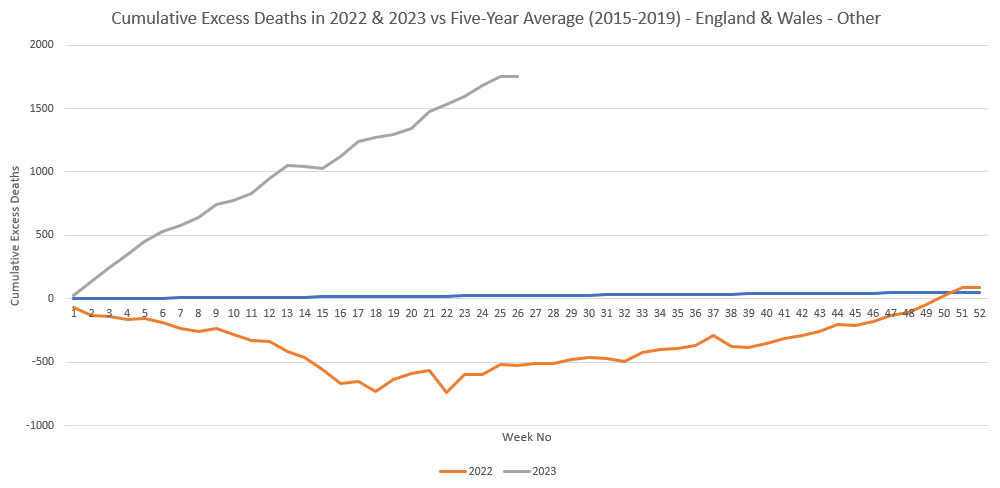
But where are these excess deaths happening? (the following charts are using the ONS’ five-year average so in reality the situation is worse)
The majority are at home which indicates that people are either avoiding hospitals, not being allowed into hospitals or dying so quickly that they never make it into a hospital. However, the cumulative number is similar to 2022.
When it comes to hospitals, we are already at the same number reached at the end of 2022.
Care homes saw zero excess deaths overall in 2022 but are already on 3,000 this year.
A similar picture with ‘other’ deaths. 2022 finished the year on approximately zero excess deaths but is around 1750 deaths already this year.
And finally, post-neonatal deaths in Scotland in April 2023. I think this data must have been adjusted because I don’t remember seeing it when I reported on still-births last month. Sadly, in April there were 8 post-neonatal deaths (deaths occurring after the first 4 weeks but within the first year).
Whilst fortunately a small number, it represents a rate of 2.8 deaths per 1,000 live births which is well above the 1.1 rate baseline. It reached the control limit and is labelled an outlier event. The only time the rate has been anywhere near this high in the last seven years, was in September 2020 when the rate was 2.4.
Will we hear anything from the Chief Medical Officer or a government representative? Of course not, they are too busy at the Covid Inquiry telling us how we should have locked down earlier and harder to ‘save’ lives. Clearly they don’t mean the lives that have been lost in the graphs above.


So "weird" how after running daily death totals on the screen 24/7, the media can't even be bothered to mention the excess deaths affecting all ages, not just the covid-susceptible.
Heartbreaking